Cart Rolling Down Ramp:
Kinematics:
A cart with a weight has a mass of 599.62 g. It starts at the top of a ramp which is 94.83 cm long, and three textbooks (13.67 cm) high. As the cart is being placed, and the buffer(hand) is removed, the cart begins to accelerate downwards.
A cart with a weight has a mass of 599.62 g. It starts at the top of a ramp which is 94.83 cm long, and three textbooks (13.67 cm) high. As the cart is being placed, and the buffer(hand) is removed, the cart begins to accelerate downwards.
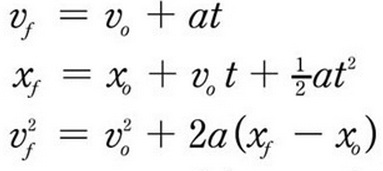
Kinematics Equations
|

|

|

|

|
|
The car's initial position at the top of the ramp was 0, accelerated down the ramp for 1.5 seconds, as shown in the graphs below, and continued to roll of the ramp.
|
Using the acceleration that we found above, we can calculate the final velocity
|
Using the final velocity and acceleration found above, we can also calculate the final position. The difference in results is due to round off error.
|
 Position vs Time Position vs Time
|

Velocity vs Time
|
|
Forces:
When the cart is rolling down the ramp, there are three external forces acting upon. These three include, friction, gravity and a normal force. The forces acting as friction include things like air drag and the friction between the ramp and wheels which slow the cart down. The force of gravity is pulling the cart down the ramp. The normal force is the ramp pushing upwards onto the cart. If there wasn't the normal force, than the cart would be falling downwards. |

Free Body Diagram
|
|
Newton's second law of motion tells us that force is mass times acceleration. The mass of the cart and weight remains constant. The velocity vs. time graph above shows that the cart is accelerating over time. This means that the force is also accelerating as the cart rolls down the ramp.
|

|
Energy:
 Energy vs Time
As the cart rolls down the ramp the kinetic energy increases as it is being converted from the potential energy. The dips in the graph can be explained by machine error. The tracker looks at a specific color scheme so if a part of the cart has the same coloring, a dip results.
The Energy Conservation Law says that the total energy of the system is constant. As the cart moves down the ramp, the potential energy decreases. This is because the height that the cart is at decreases. The potential energy is then converted to kinetic energy. That is why the graph has a positive slope. Energy is conserved, but the potential energy was not all converted to kinetic energy because some of this energy was lost to friction, and other outside forces.
The Energy Conservation Law says that the total energy of the system is constant. As the cart moves down the ramp, the potential energy decreases. This is because the height that the cart is at decreases. The potential energy is then converted to kinetic energy. That is why the graph has a positive slope. Energy is conserved, but the potential energy was not all converted to kinetic energy because some of this energy was lost to friction, and other outside forces.

Original Kinetic Energy
|

Final Kinetic Energy
|
In the beginning, the cart did not move making the velocity 0 m/s. This would've made the kinetic energy be 0J. As the cart rolled down the ramp, the kinetic energy increased since the velocity increased. The final kinetic energy would be 0.0431 J.

Original Potential Energy
|

Final Potential Energy
|
In the beginning, the cart was at its highest height. By plugging in the values, you get the potential energy is 0.80 J. As the cart tolled down the ramp, the height of the cart would be decreasing. Eventually the height would've decreased to 0 m. The final potential energy would be 0 J.
From the information above, you see that the original energy is 0.80 J (sum of potential and kinetic). However by the time the car reaches the bottom of the ramp, the final energy is 0.0431 J. Energy was conserved since the potential energy transferred to kinetic. However since we end up with less energy than we started with, we know that not all of the energy was conserved. This would be because as the cart went down the ramp, some of the potential energy was lost due to friction and other external forces.
Sources
http://www.physicsclassroom.com/mmedia/energy/ie.cfm
http://www.physicsclassroom.com/class/vectors/Lesson-3/Inclined-Planes
http://www.physicsclassroom.com/class/vectors/Lesson-3/Inclined-Planes
